Snap Count and Target Share: The Volume Behind NFL Props
 Available in US
Opportunity is the only thing you can count on
Early in my betting life I chased talent, and talent kept letting me down on Sundays. The lesson that turned things around was learning to chase opportunity instead. Snap count and target share are usage metrics that measure how much a player is on the field and how much of his team’s passing attention he commands, and they are the single most reliable foundation for projecting any player prop. A player cannot produce statistics he never has the chance to produce, and these numbers measure exactly that chance.
The insight underneath all of this is that production is opportunity multiplied by efficiency, and opportunity is far more stable than efficiency. A receiver’s catch rate or yards per target bounces around week to week, but the number of snaps he plays and the share of targets he draws are sticky, dictated by his role and his team’s design rather than by the random fortunes of a single game. Bet on opportunity and you are betting on something predictable; bet on efficiency alone and you are betting on noise.
This is not a fringe theory; it is how the most-bet markets actually behave. The anytime touchdown scorer market is the most-backed player prop by handle, and the players who score touchdowns are overwhelmingly the players who get the opportunities, the goal-line carries, the red-zone targets, the snaps inside the ten. Usage drives the very outcomes that the biggest prop markets are built on, which is why understanding it is not optional for a serious prop bettor.
Turn red zone data into anytime touchdown scorer selections.
Why volume wins over talent
Consider two receivers of equal ability. One plays 85 per cent of his team’s snaps and draws a quarter of its targets; the other rotates in for half the snaps and draws a tenth of the targets. The first will out-produce the second almost every week, not because he is better, but because he gets the ball more. That gap, driven entirely by opportunity rather than skill, is the heart of why volume beats talent for prop projection. The screen tells you who is famous; the usage tells you who will actually accumulate.
The reason volume is so much more bettable is its consistency. A player’s role tends to hold from week to week, because it is set by the coaching staff and the depth chart, not by luck. A feature back keeps getting the carries; a number-one receiver keeps drawing the targets; a three-down player keeps playing the snaps. Efficiency, by contrast, is volatile, a receiver can run the same routes and catch eight balls one week and three the next on identical usage. When I project a prop, I anchor it to the stable input, volume, and treat efficiency as the noisy variable around it.
This is why the busiest scorer markets reward usage analysis so directly. The most-backed prop on the board, anytime touchdown scorer, is fundamentally an opportunity market: the players who score are the ones handed the high-value touches near the end zone. A bettor who reads usage is reading the input that actually generates the outcome, while a bettor reading reputation is one step removed from it. Opportunity is upstream of production, and betting upstream is where the clarity lives.
Reading usage the right way
The two metrics work together, and reading them well means understanding what each one captures. Snap count is the number of offensive plays a player is on the field for, the rawest measure of involvement. A high snap count is necessary for production but not sufficient, because a player can be on the field for blocking or as a decoy without ever getting the ball. Snap count tells you a player has the chance to be involved; it does not promise he will be.
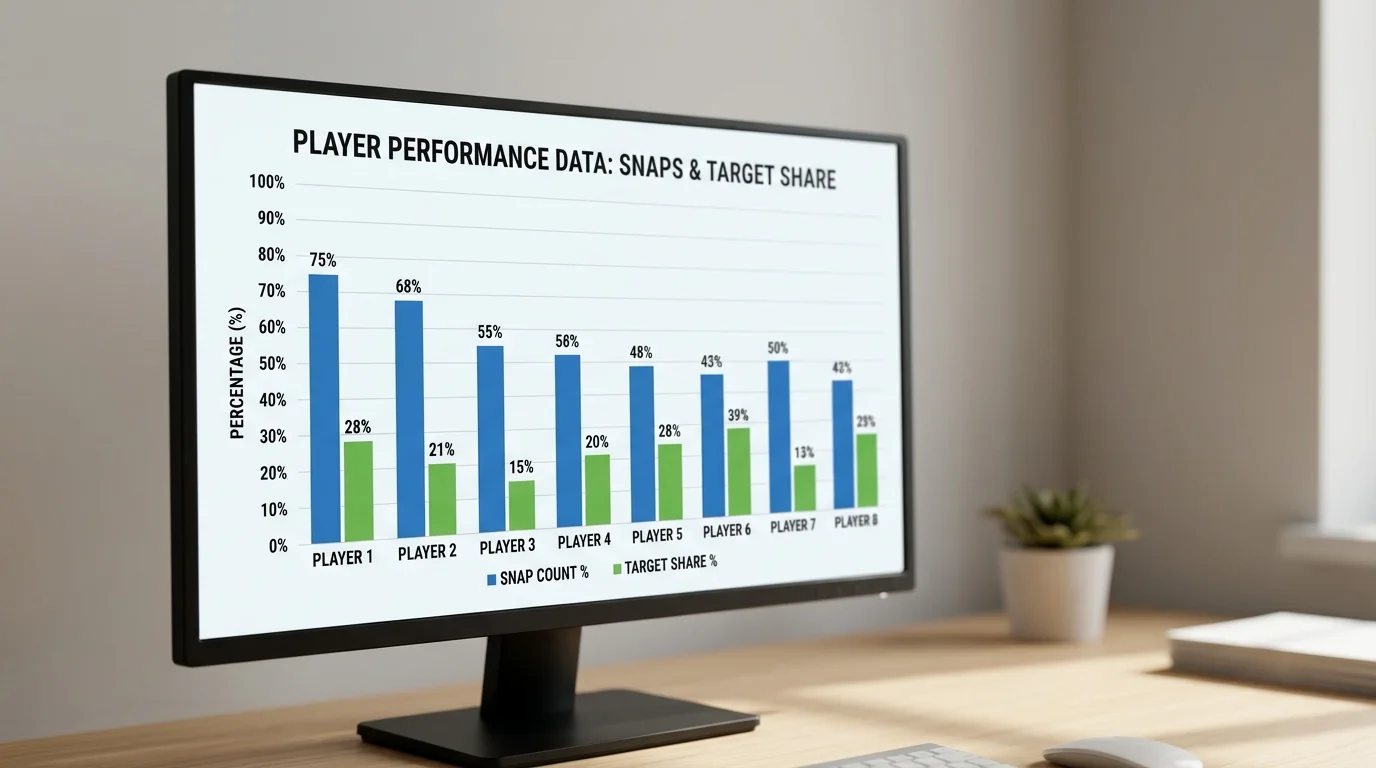
Target share fills that gap for pass-catchers. Target share is the percentage of a team’s total targets that go to one player, and it is the cleanest single read on how central a receiver is to the passing game. A high target share means the offence is deliberately funnelling the ball to that player, which is the strongest predictor of receiving production there is. Where you find this data is straightforward, target share is a standard figure on most football statistics sites, calculated from a player’s targets divided by his team’s total. Together, snaps and target share answer the two questions that matter: is he on the field, and when he is, does the offence look his way?
The nuance is reading them in combination and watching for change. A player whose snap count is rising week on week may be growing into a larger role before his target share has caught up, which is an opportunity the market can be slow to price. A player whose snaps are high but target share is low is a production trap, on the field but not getting the ball. Reading the trend, not just the snapshot, is where usage analysis earns its keep.
Visit best nfl player prop bets for advanced NFL prop analysis.
Applying usage to actual prop bets
Turning usage into a bet means building your projection from opportunity first, then layering efficiency and matchup on top. For a receiving prop, I start with expected targets, derived from target share and the game’s projected pass volume, then apply a realistic catch rate and yards figure. The target number does most of the work, because it is the stable input, while the efficiency assumptions are where I stay conservative, knowing they are noisy. The result is a projection anchored to something predictable rather than to a hope about how a player will perform.
The biggest edges from usage appear where the market lags a role change. Player props, and especially the more exotic ones on secondary players, sit in a less efficient market because bookmakers have less historical data to price them tightly. When a backup inherits a starter’s snaps through injury, or a receiver quietly climbs the target hierarchy, the book may not have repriced his usage, leaving his props soft for a week or two until the new role is established in the data. Those windows, where the usage has changed but the line has not, are some of the cleanest value in prop betting.
Red-zone usage deserves special attention for scoring props. A player’s share of his team’s snaps and targets inside the twenty-yard line predicts touchdown production far better than his overall numbers, because touchdowns happen in that compressed space. A back who dominates goal-line carries or a receiver who is the red-zone target is a credible scoring bet even on modest overall usage. That logic feeds directly into the most-backed market on the board, which I cover in how to bet the anytime touchdown scorer market. Read the usage, especially near the end zone, and the scorer markets stop looking like guesses and start looking like the opportunity bets they really are.
What is target share and where do I find it?
Target share is the percentage of a team’s total targets that go to one player, calculated from his targets divided by the team’s total targets. It is the cleanest single read on how central a receiver is to the passing game, since a high share means the offence is deliberately funnelling the ball to him. It is a standard figure on most football statistics sites, listed alongside snap counts and other usage metrics.
Does a high snap count guarantee production?
No. A high snap count is necessary but not sufficient. It tells you a player is on the field and has the chance to be involved, but he can be out there for blocking or as a decoy without ever getting the ball. That is why snap count is best read alongside target share for pass-catchers: snaps show the opportunity to be involved, while target share shows whether the offence actually looks his way when he is on the field.
How does red-zone share help touchdown props?
Touchdowns happen in the compressed space inside the twenty, so a player’s share of snaps and targets in the red zone predicts scoring far better than his overall numbers do. A back who dominates goal-line carries or a receiver who is the primary red-zone target is a credible scoring bet even on modest overall usage. Focusing on red-zone opportunity rather than total volume is the key to reading the anytime touchdown scorer market well.
Prepared by the Best nfl Player Prop Bets editorial staff.